React Native is a popular framework for building mobile applications that allows developers to write code in JavaScript and deploy it across multiple platforms. While this approach offers many benefits, it can also lead to performance issues that can be difficult to diagnose without the right tools. Fortunately, React Profiler is a powerful tool that can help identify performance bottlenecks in React Native apps.
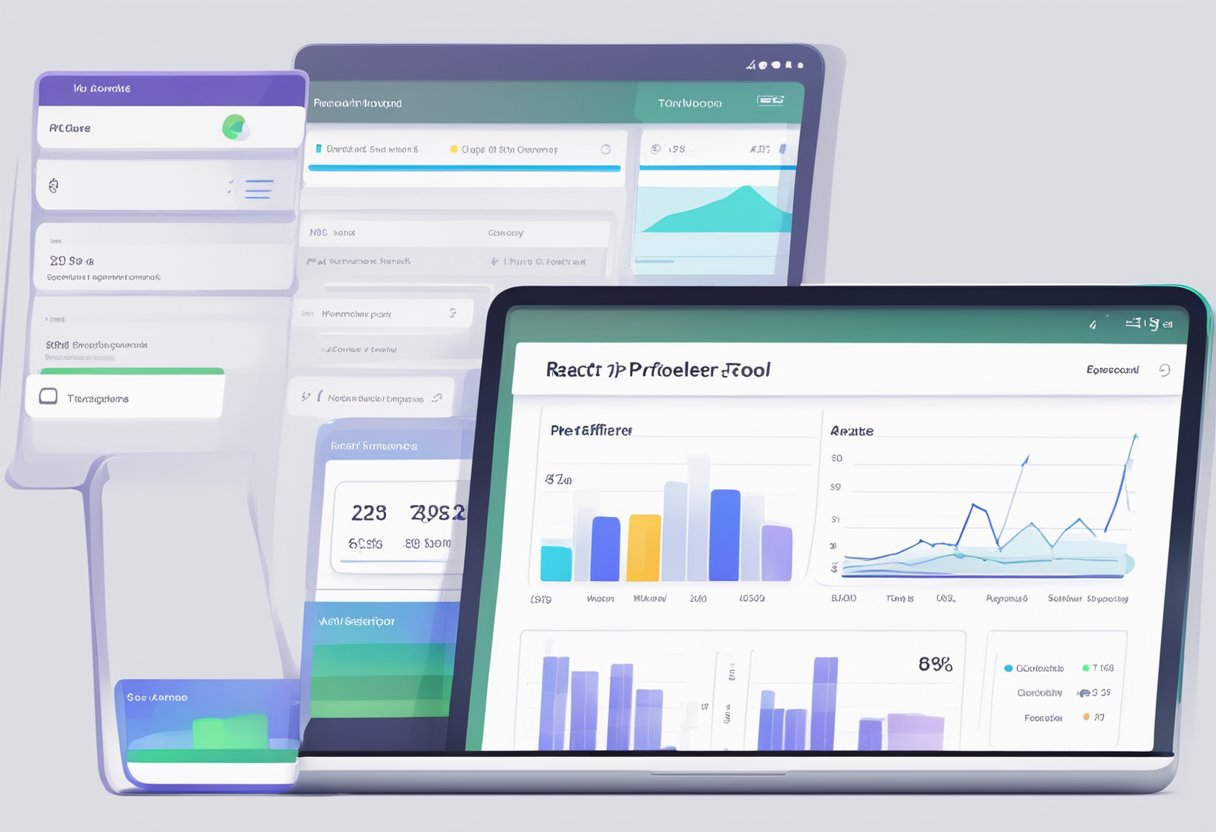
React Profiler is a tool that allows developers to analyze the performance of their React applications by measuring the time it takes to render each component. This information can be used to identify components that are causing performance issues and optimize them for better performance. By using React Profiler, developers can ensure that their apps are running smoothly and providing a good user experience.
In this article, we will explore how to use React Profiler to identify performance bottlenecks in React Native apps. We will cover the basics of React Profiler, including how to install and use it, and provide examples of how it can be used to optimize app performance. Whether you are a seasoned React Native developer or just getting started, this article will provide valuable insights into how to improve the performance of your apps.
Understanding React Profiler
Overview of React Profiler
React Profiler is a tool that helps developers identify performance bottlenecks in React applications. It allows developers to visualize how long it takes for each component to render and how often it renders. This information can be used to optimize the performance of the application.
React Profiler works by recording the timing information of each component’s render method. It then displays this information in an interactive flame graph, which makes it easy to identify which components are taking the most time to render.
Setting Up React Profiler in React Native
To use React Profiler in a React Native application, developers need to add the “react-devtools” package to their project. They can then run the devtools in a separate window or as a browser extension.
Once the devtools are running, developers can select the React Profiler tab and start profiling their application. They can then interact with their application and see how long each component takes to render.
Interpreting Profiler Data
The React Profiler flame graph displays each component as a rectangle. The width of the rectangle represents the amount of time it took for the component to render, and the color represents the percentage of time spent rendering that component compared to the total render time.
Developers can use this information to identify which components are taking the most time to render and optimize their performance. They can also use the “Hide components with similar props” feature to group similar components and see how they are performing as a group.
In summary, React Profiler is a powerful tool for identifying performance bottlenecks in React Native applications. By visualizing the timing information of each component’s render method, developers can optimize the performance of their application and provide a better user experience.
Optimizing React Native Performance
React Native is a popular framework for building cross-platform mobile applications. It provides developers with a set of tools to create high-performance, native-like apps. However, as with any technology, there are performance bottlenecks that can slow down an app’s performance. In this section, we will discuss some common performance bottlenecks, best practices for performance improvement, and a case study on performance tuning.
Common Performance Bottlenecks
There are several common performance bottlenecks that can affect the performance of React Native apps. These include:
- Excessive re-renders: React re-renders components when their state or props change. If a component re-renders too frequently, it can cause performance issues. To avoid this, developers can use shouldComponentUpdate or React.memo to optimize rendering.
- Large images: Large images can cause slow load times and performance issues. Developers can optimize images by compressing them or using smaller images.
- Inefficient data fetching: Inefficient data fetching can cause slow load times and performance issues. Developers can optimize data fetching by using pagination, caching, and lazy loading.
Best Practices for Performance Improvement
To improve the performance of React Native apps, developers can follow these best practices:
- Use the React Profiler: The React Profiler is a tool that can help developers identify performance bottlenecks in their apps. It provides detailed information on how long it takes for components to render and update.
- Optimize images: Developers can optimize images by compressing them or using smaller images. They can also use the resizeMode prop to adjust the size and scale of images.
- Minimize the number of re-renders: Developers can minimize the number of re-renders by using shouldComponentUpdate or React.memo to optimize rendering.
- Use FlatList or SectionList: FlatList and SectionList are optimized list components that can improve the performance of list rendering.
- Implement lazy loading: Developers can implement lazy loading to improve the performance of data fetching. This involves loading data as the user scrolls down the page, rather than loading all data at once.
Case Study: Performance Tuning
To demonstrate the effectiveness of performance tuning, let’s consider a case study. A developer was tasked with improving the performance of a React Native app that was experiencing slow load times and frequent crashes.
After analyzing the app with the React Profiler, the developer identified several performance bottlenecks, including excessive re-renders and inefficient data fetching. They implemented several optimizations, including using shouldComponentUpdate to minimize re-renders, optimizing images, and implementing lazy loading.
As a result of these optimizations, the app’s performance improved significantly. Load times were reduced, and the app was much more stable, with fewer crashes. By following best practices for performance improvement and using tools like the React Profiler, developers can optimize the performance of their React Native apps and provide a better user experience.